| デベロッパー: | Jiří Maier (1) | ||
| 価格: | フリー | ||
| ランキング: | 0 | ||
| レビュー: | 0 レビューを書く | ||
| リスト: | 0 + 0 | ||
| ポイント: | 0 + 0 ¡ | ||
| ポイント + 1 | |||
説明
")
The communication protocol is designed to be as simple as possible to implement on the MCU firmware side. Data can be transmitted in binary format or as text.
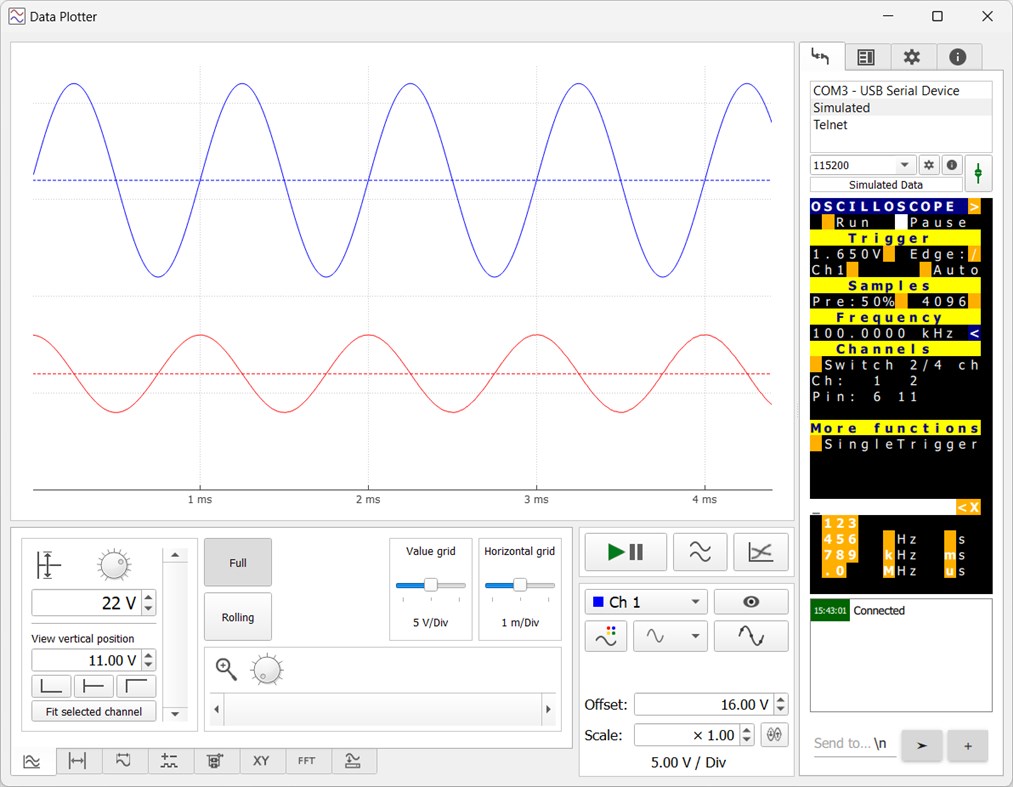
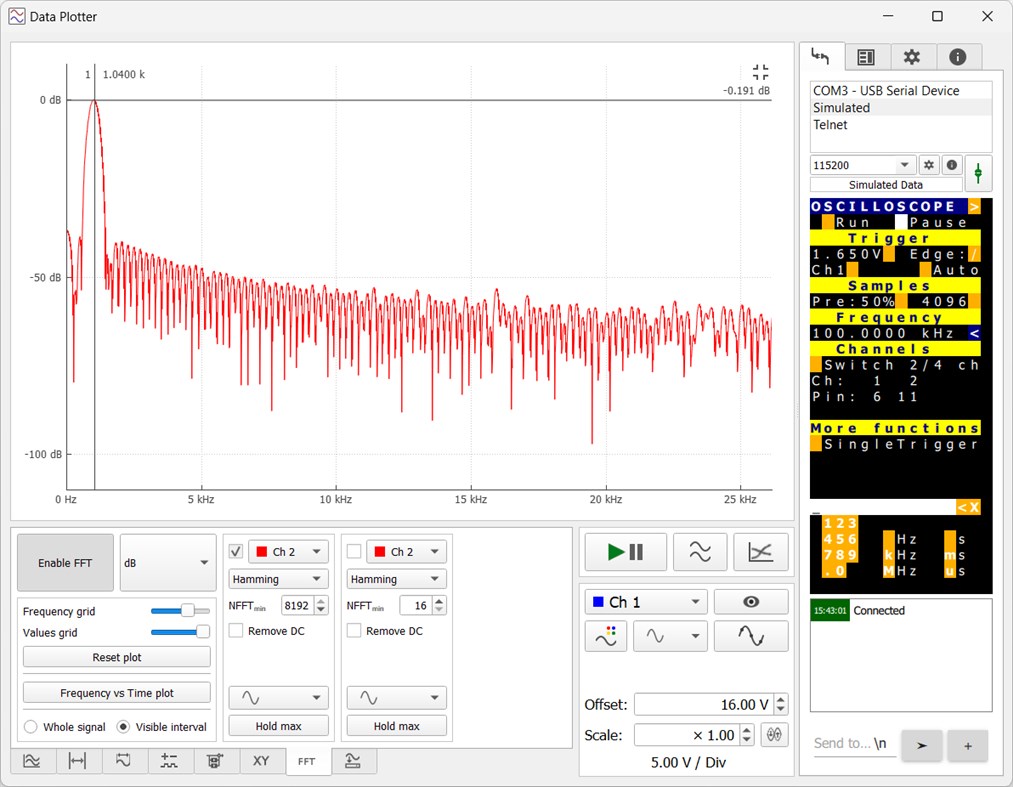
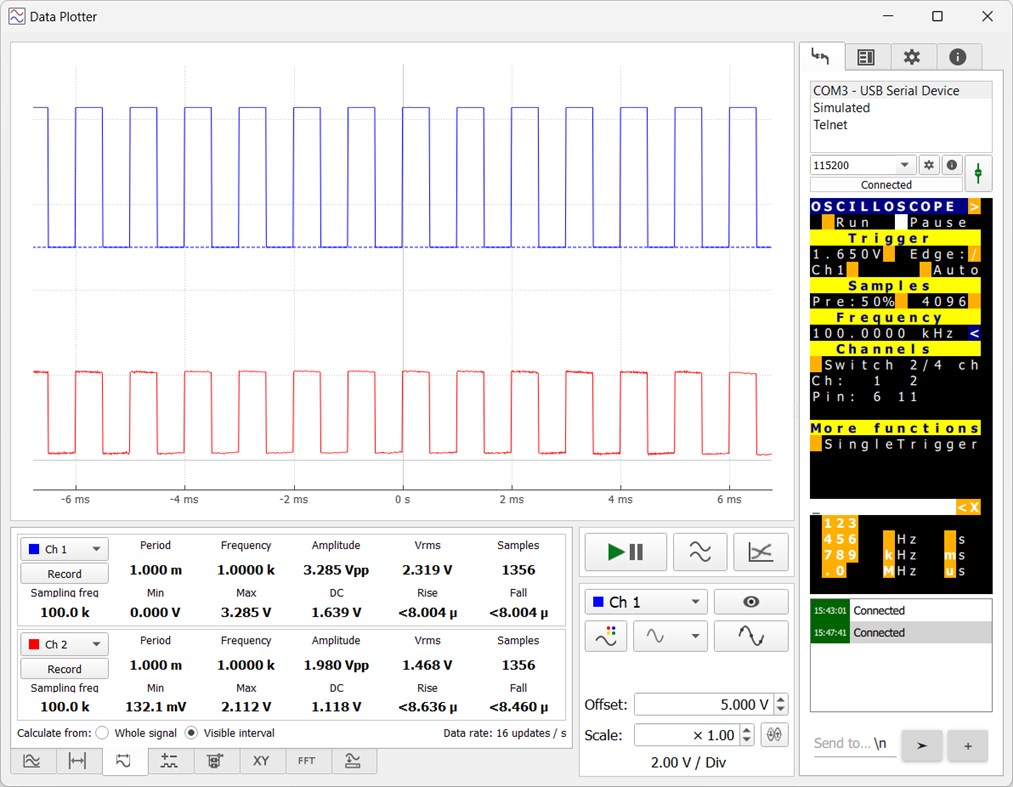
The capabilities of DataPlotter are similar to oscilloscopes, it can plot the data (obviously), perform FFT and automatic measurements, and save data to a CSV file or as an image. There are also cursors and XY modes. The plot can operate either in oscilloscope mode (data received as an array of samples captured over a short time period) or in rolling mode (data received point-by-point and continuously appended to previous data over a long time period). There is also support for logic (digital) channels.
There are various means of controlling the instrument from the DataPlotter:
There is an ANSI terminal emulator that supports escape sequences (you can move the cursor, change text color and background color, etc.). This allows the creating of a pseudo-graphical UI for displaying measured data and settings. It also includes an interactive feature: if a character in the terminal has a colorful background, it can be clicked to send that character to the instrument. This allows you to create buttons in the terminal. The command sent by that button is in principle one byte (the character on that button) so it is very easy to process on the MCU (no parser, just UART ISR or whatever). Some characters have good meaning on the buttons (e.g. + - / ), but if you run out of meaningful characters, you can just hide the character by setting the font color the same as the background and label the button with text next to it.
Another way of dynamically creating instrument controls is QML (QtQuick language). The QML code can be sent to DataPlotter by the instrument (microcontroller) and the new GUI will be shown. There is a minimalistic (easy-to-use) interface for sending and receiving data from the QML code. This offers almost endless possibilities for customization.
スクリーンショット
新機能
- バージョン: PC
- アップデート:
価格
- 今日: フリー
- 最小値: フリー
- 最大: フリー
料金のチェック
デベロッパー
- Jiří Maier
- プラットフォーム: Windows アプリ (1)
- リスト: 0 + 0
- ポイント: 0 + 0 ¡
- ランキング: 0
- レビュー: 0
- 割引: 0
- 動画: 0
- RSS: 購読する
ポイント
見つかりませんでした ☹️
ランキング
見つかりませんでした ☹️
リスト
見つかりませんでした ☹️
レビュー
最初のクチコミを書こう!
情報
連絡先
あなたも好きかも
-
- Data Charts
- Windows アプリ: 開発者ツール 作者: WTCube
- フリー
- リスト: 0 + 0 ランキング: 0 レビュー: 0
- ポイント: 0 + 0 バージョン: PC Data Charts is an application to request JSON from an REST endpoint quickly in the form of charts. It can save the URL and the value to display for quick lookup.
-
- Data Table Comparer
- Windows アプリ: 開発者ツール 作者: MKA Solutions
- $6.99
- リスト: 0 + 0 ランキング: 0 レビュー: 0
- ポイント: 0 + 0 バージョン: PC The perfect tool for data table comparison. Can load excel and csv files and sql databases.
-
- Hexa Data Reader
- Windows アプリ: 開発者ツール 作者: L.Moriarty
- フリー
- リスト: 0 + 0 ランキング: 0 レビュー: 0
- ポイント: 0 + 1 バージョン: PC This app would help you to view the data in the file in hexadecimal code.
-
- AnSam Serial Port Plotter
- Windows アプリ: 開発者ツール 作者: AnSam Freedive
- $3.99
- リスト: 0 + 0 ランキング: 0 レビュー: 0
- ポイント: 0 + 0 バージョン: PC It shows the data of the connected serial device in graphs and logs. It connects hardware devices such as Arduino and PC and conveniently performs data transmission and reception. In ...
-
- LOGGBOK - Arduino Data Logging and Monitoring
- Windows アプリ: 開発者ツール 作者: Sebastian Strobl
- フリー
- リスト: 1 + 0 ランキング: 0 レビュー: 0
- ポイント: 4 + 0 バージョン: PC It may seem impossible to easily bring sensor data from the Arduino to your PC, but with LOGGBOK things look a little bit different. This windows applications is made for this specific
-
- SensorTag Data Acquisition
- Windows アプリ: 開発者ツール 作者: RS Systems
- フリー
- リスト: 0 + 0 ランキング: 0 レビュー: 0
- ポイント: 0 + 1 バージョン: PC This app is aimed to facilitate the data capturing from multiple TI SensorTag CC2650 modules. IMU (Accelerometer, angular velocity, magnetic field), Luxmeter, Humidity, Barometer, IR ...
-
- DSE Inline Diff
- Windows アプリ: 開発者ツール 作者: Data Safety Expert
- フリー
- リスト: 1 + 0 ランキング: 0 レビュー: 0
- ポイント: 2 + 1 バージョン: PC Text file comparison tool. Compares two text files and displays differences in different colors. Also compares different lines and displays different characters in different colors. ...
-
- CRMT
- Windows アプリ: 開発者ツール 作者: Mythosia
- * フリー
- リスト: 0 + 0 ランキング: 0 レビュー: 0
- ポイント: 0 + 0 バージョン: PC Professional COM port debugging software. 00. 100% English supported. (The screenshot was captured in the Korean version and is displayed in English in the English version of Windows. ...
-
- Encrypted Covert Channel
- Windows アプリ: 開発者ツール 作者: James Kwon
- フリー
- リスト: 0 + 0 ランキング: 0 レビュー: 0
- ポイント: 0 + 0 バージョン: PC I made this as a my final project of CST Btech program at BCIT. Encrypted Covert channel is a type of computer software attacks that allow the communication of information by ...
-
- Flow CSV Viewer
- Windows アプリ: 開発者ツール 作者: Waveworks
- フリー
- リスト: 0 + 0 ランキング: 0 レビュー: 0
- ポイント: 1 + 10 バージョン: PC Flow CSV Viewer is a light-weight tool for viewing, plotting and analyzing time series data files in CSV format. It's designed to be extremely quick and easy to use. It opens any valid
-
- Clobbr - API load & speed test
- Windows アプリ: 開発者ツール 作者: Dan Mindru
- $32.49
- リスト: 0 + 0 ランキング: 0 レビュー: 0
- ポイント: 0 + 2 バージョン: PC Clobbr is a developer tool that allows you to test your api endpoints to see how well they perform under multiple requests (clobber your apis!), in sequence or parallel. Regardless if ...
-
- Modbus Slave Emulator
- Windows アプリ: 開発者ツール 作者: Redisant
- $29.99
- リスト: 0 + 0 ランキング: 0 レビュー: 0
- ポイント: 0 + 1 バージョン: PC - Supports multiple Modbus protocols, including: Modbus RTU, Modbus ASCII, Modbus TCP/IP, Modbus UDP/IP, Modbus RTU Over TCP/IP, Modbus RTU Over UDP/IP. - Monitor communication data on
-
- SCADAvis.io Synoptic Editor
- Windows アプリ: 開発者ツール 作者: DSC_Systems
- $19.99
- リスト: 1 + 0 ランキング: 0 レビュー: 0
- ポイント: 0 + 0 バージョン: PC SCADAvis.io Synoptic Editor is a powerful tool to create synoptic graphics that can be animated with real-time data on any modern web browser (mobile or desktop). This editor is based ...
-
- HexToolkit
- Windows アプリ: 開発者ツール 作者: BinaryEarth
- $1.29
- リスト: 0 + 0 ランキング: 0 レビュー: 0
- ポイント: 0 + 2 バージョン: PC This is a very useful hex viewer/editor which can view any file and has some handy features which make it easier to reverse engineer binary file formats. Features: * Works easily with ...